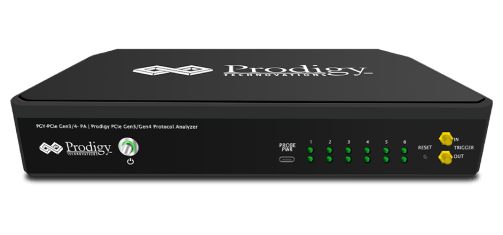
PGY-UFS4.0-PA, UFS Protocol Analyzer is the industry-first working and tested UFS4.0 Protocol Analyzer. It offers protocol data capture and debugging of data across MPHY, UniPro, and UFS protocol layers. It allows for instantaneous decoding of UFS, UniPro, and MPHY layers with the flexibility to correlate decoded data across these protocol layers. PGY-UFS4.0-PA supports PWMG1 to HSG5B data rates and two TX, and two RX lane decode. The active probe has minimum electrical loading on the device under test (DUT) and captures protocol data without affecting the performance of DUT. PGY-UFS4.0- PA Protocol Analyzer supports two-lane data. Comprehensive on the fly decoding of UniPro & UFS data enables validation of communication between UFS host and device.
PGY-UFS4.0-PA Protocol Analyzer allows Design and Test Engineers to obtain deep insight into UFS host and device communication. MPHY/UniPRO/UFS packet-based triggering allows specific protocol data capture and analysis. PGY-UFS Protocol analyzer instantaneously provides decoding of UFS, UniPro, and MPHY layers with a correlation to MPHY, UniPro, and UFS layers.
The PGY-USB3.1 software helps in analyzing both LFPS and Superspeed patterns.
Features
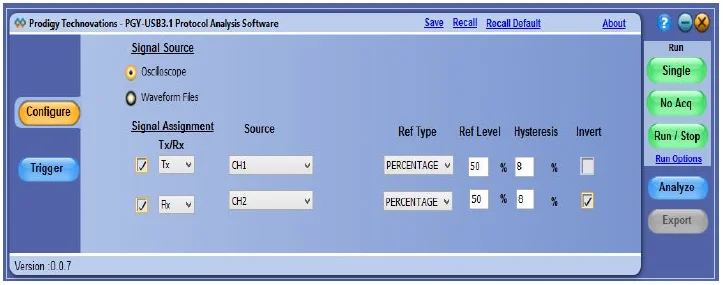
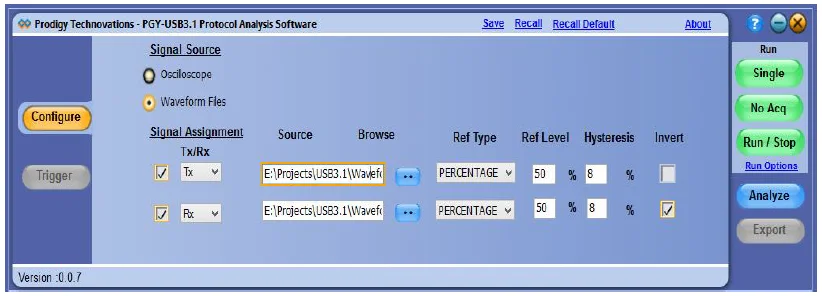
1. The configuration panel enables the user to load the Tx and Rx signals.
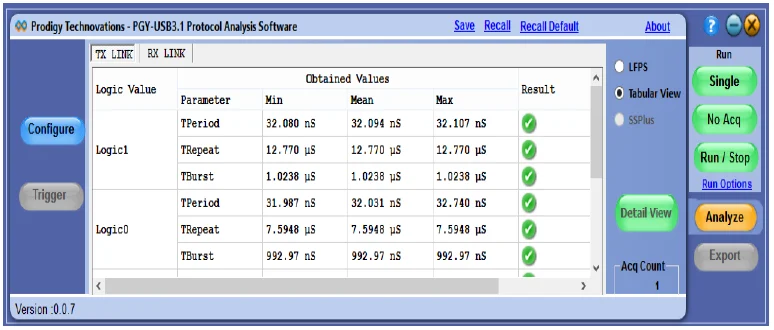
2. The tabular view displays TPeriod, TRepeat, and TBurst values in LFPS mode for Logic 1 & 0.
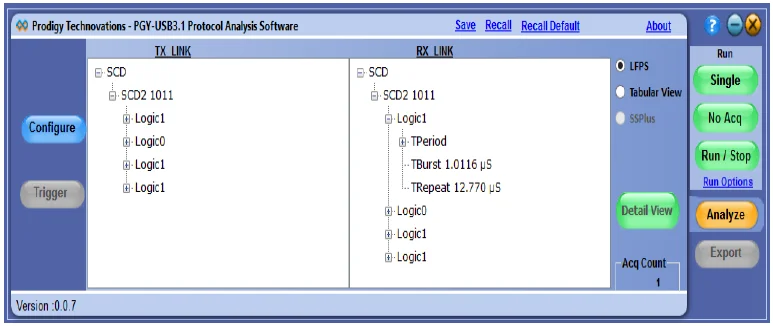
3. The tree view gives the LFPS type and timing-related values of each Logic one and 0 of the LFPS type.
4. Invert option has been given in case the waveform that was captured is inverted.
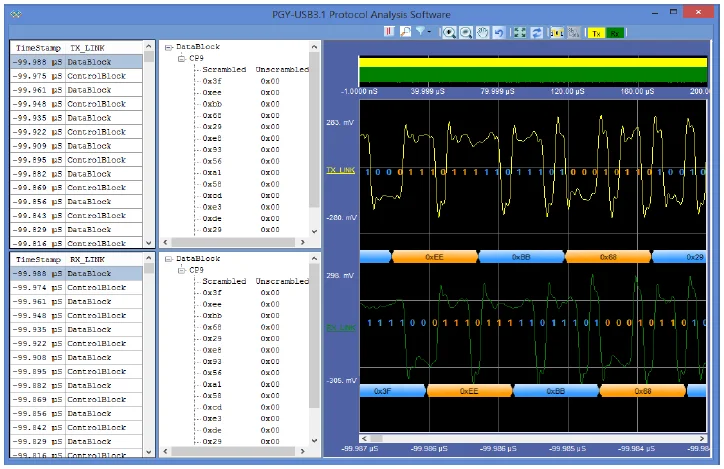
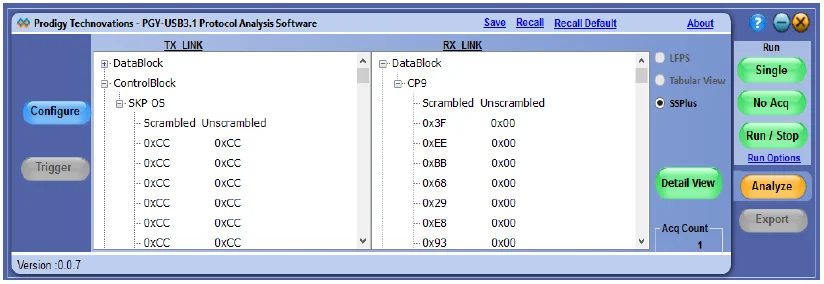
5. After the waveform has been analyzed, the results are displayed by differentiating it into Datablock and ControlBlock. The type of packet that has been captured is shown. (In this version of the software, the inner packet details are not shown). Both the scrambled bytes that have been captured and their unscrambled value is displayed in the software.
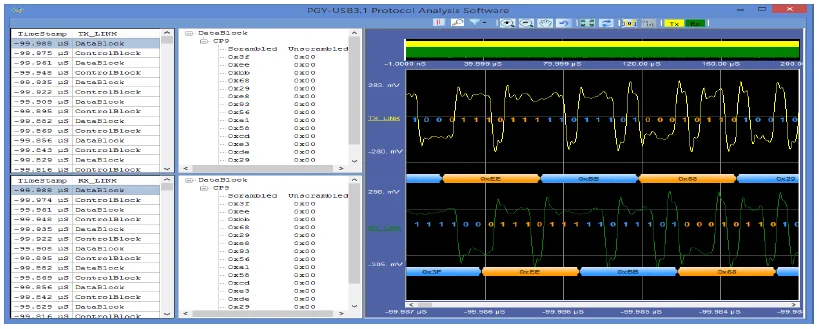
The Detail View window gives details of the bytes in each data block/control block as well as the time at which the packet has been captured. The waveform plot is linked with the packet being displayed on the grid. The plot contains various features like a bus diagram, zoom, pan, representation of bits on the waveform, and cursors.
PGY-UFS4.0-PA, UFS Protocol Analyzer is the industry-first working and tested UFS4.0 Protocol Analyzer. It offers protocol data capture and debugging of data across MPHY, UniPro, and UFS protocol layers…